Pattern detection
Highlights key price formations so you can quickly spot compressions, reversals and breakout areas.
Professional iPhone app that helps you read charts with AI, key zones, structure and clean visual tools in seconds.
Early version: new analytics modules will be added gradually and included in your subscription.
.png)
.png)
.png)
.png)
.png)
SmartChart Lens starts with three core modules that cover most technical scenarios. More analytics layers will be added on top over time.
Choose the monthly or yearly plan. Pricing is shown by language: SAR in Arabic and USD in English.
Monthly access for traders who want a flexible plan on iPhone.
Best yearly value for traders who use SmartChart Lens regularly on iPhone.
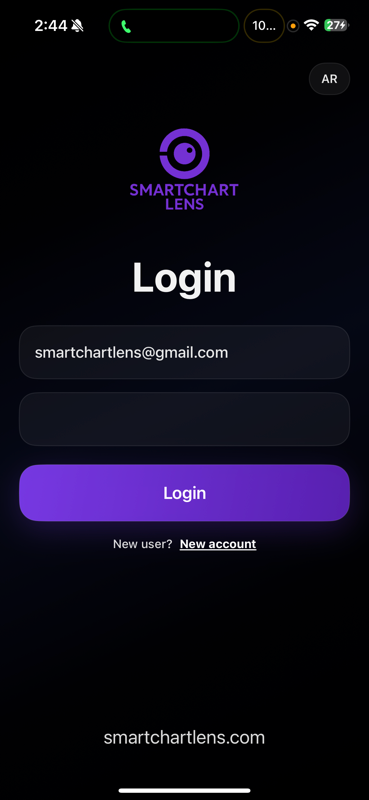
Create your account, choose your plan, then download the iPhone app and sign in with the same account.
For questions about access, billing or roadmap, reach out directly. We’re keeping feedback very close in the early versions.
Effective Date: August 2025
Welcome to SmartChart Lens. By accessing or using our website and services, you agree to be bound by the following Terms and Conditions.
By accessing the SmartChart Lens website or using any of its services, you confirm that you have read, understood, and agree to be bound by these Terms and Conditions.
SmartChart Lens provides AI-powered tools for analysing financial charts, including pattern detection, Fibonacci level drawing, trend direction identification, and more. Our services are intended for informational and educational purposes only and are not financial or investment advice.
You must be at least 18 years old to use this site or create an account.
We offer a free trial and subscription-based plans (monthly and yearly). By subscribing, you agree to the terms of the selected plan and authorize us to charge your payment method on a recurring basis until cancelled. All payments are non-refundable unless otherwise stated.
All content on the SmartChart Lens website, including text, graphics, logos, software, and tools, is the property of SmartChart Lens or its licensors.
You agree not to use the website for any unlawful or unauthorized purpose, interfere with the operation of the site, attempt to gain unauthorized access, or resell the service.
SmartChart Lens does not guarantee the accuracy, completeness, or profitability of any analysis or signal. Use of our tools is at your own risk.
To the maximum extent permitted by law, SmartChart Lens shall not be liable for any direct, indirect, incidental, or consequential damages arising out of the use or inability to use the services.
We may suspend or terminate your access for conduct that violates these Terms or is harmful to other users, us, or third parties.
SmartChart Lens may update these Terms from time to time. Continued use of the site constitutes acceptance of the updated Terms.
These Terms and Conditions are governed by the laws of Saudi Arabia.
For questions about these Terms, please contact us at: support@smartchartlens.com.
Effective Date: August 2025
At SmartChart Lens, we respect your privacy and are committed to protecting the personal information you share with us.
We use the information to provide and improve our services, manage subscriptions and payments, send service-related emails, analyse usage, and ensure security.
We use cookies to maintain sessions, remember preferences, and analyse site usage. You can control cookies via your browser settings.
We may use third parties for payment processing, analytics, and email communication. They only receive the information necessary to perform their functions.
We implement industry-standard security measures and retain personal data only as long as necessary or as required by law.
Depending on your location, you may have rights to access, correct, delete, or restrict the use of your data, and to withdraw consent.
SmartChart Lens is not intended for children under 13 and we do not knowingly collect data from them.
Our services are hosted in Saudi Arabia. Your data may be transferred to and processed in Saudi Arabia.
We may update this Policy from time to time. Continued use of the site means you accept the changes.
For any questions about this Privacy Policy, please contact us at: support@smartchartlens.com.